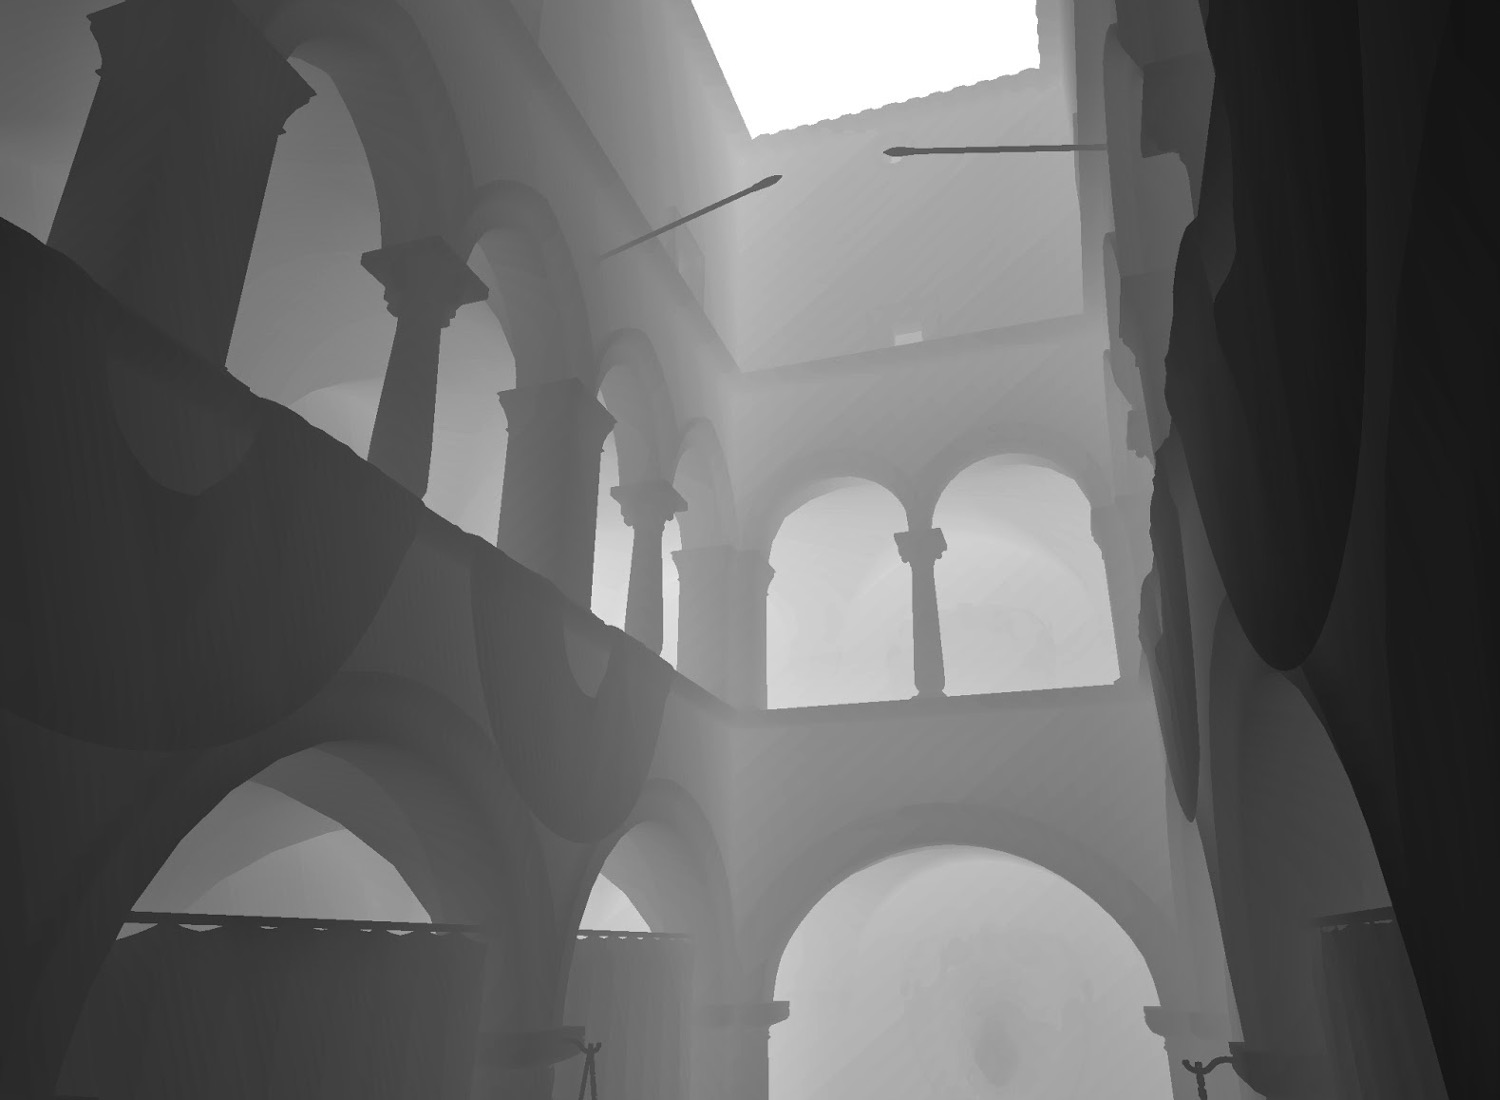
Sometimes it can be quite useful to visualize the depth buffer of a rendered frame. Several rendering techniques such as shadow mapping and depth pre-pass rely on the depth buffer. It is always handy to visualize it in real time to make sure it is being written as expected.
With modern hardware and modern rendering APIs such as OpenGL and Direct3D, you can usually just read the depth buffer directly into a depth texture. In OpenGL for example, a copy of the current depth buffer can be done with:
void CopyDepthBuffer(GLuint texId, int x, int y, int imageWidth, int imageHeight)
{
    glBindTexture(GL_TEXTURE_2D, texId);

    glReadBuffer(GL_BACK); // Ensure we are reading from the back buffer.
    glCopyTexImage2D(GL_TEXTURE_2D, 0, GL_DEPTH_COMPONENT, x, y, imageWidth, imageHeight, 0);
}
Once copied, you can render a full-screen quadrilateral and apply the depth texture onto it as a means of visualizing the buffer.
However, depending on your scene and the depth range of it, you might get just a blank screen if you do so. This is because the
range of your scene’s depth is so huge that when the depth buffer values are mapped to the [0,1] range of a color image, all
the pixels end up pretty close to 1 (white).
To work around this issue, it is necessary to linearize the depth buffer values. To do so, I use the following Fragment Shader when rendering the full-screen quad which I apply the depth texture on:
// 'colorImage' is a sampler2D with the depth image
// read from the current depth buffer bound to it.
//
float LinearizeDepth(in vec2 uv)
{
    float zNear = 0.5;    // TODO: Replace by the zNear of your perspective projection
    float zFar  = 2000.0; // TODO: Replace by the zFar  of your perspective projection
    float depth = texture2D(colorImage, uv).x;
    return (2.0 * zNear) / (zFar + zNear - depth * (zFar - zNear));
}

void main()
{
    float c = LinearizeDepth(texCoords);
    gl_fragColor = vec4(c, c, c, 1.0);
}
The previous code was pretty much lifted from Geeks3D. They have some useful links there too and some more info about the depth buffer.
By linearizing the depth image you get this ghostly-like visual, where darker indicates a lower depth (closer to the camera) and white a greater depth (away from the camera).
